|
|
SAINT ...PHONIE | |||
THE CARDIO-BREATHING SYSTEM |
||||
|
The medical literature points a special attention on the investigation of cardiac variability (HRV). It is now well established that a healthy heart offers a variability which shows some flexibility. This flexibility is reduced with aging and according to the state of the heart.
Fig. 1 : two minutes of recording of the variation of the cardiac rhythm of a resting subject. This curve is a wave from which the various components can be analyzed by a mathematical process. In this case, we obtain a spectrum of the various frequencies components (represented according to their respective power) which compose this wave
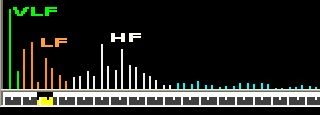
(fig. 2):
The spectrum of the variability of cardiac rhythm (HRV) shows three significant wavebands respectively called HF (high frequencies), LF (low frequencies) and VLF (very low frequencies). . (references HRV1, HRV2)
Currently, the measurement of these various parameters is carried out in two different ways:
The relative proportion of these various wavebands gives information on the stress or on the health condition of the cardiovascular system. The ratio LF/HF is often used to monitor the recovery of the heart after a heart attack (reference HRV2). The computer interface system I propose allows the representation and visualisation IN REAL TIME of the three waves corresponding to the components HF, LF and VLF of the variations of the cardiac rhythm. This system also integrates information on breathing, allowing a direct visualisation of the impact of the respiration on these three parameters (fig. 3)
Fig 3: real time drawing of the variations of cardiac rhythm HRV (in light blue), of breathing (dark blue), HF (white),
|
|||
| Tous
droits réservés - © P. BOTTE 2010 - compteur statistique
:
|