 |
SAINT ...PHONIE | |||
MATHEMATICAL ANALYSIS |
||||
|
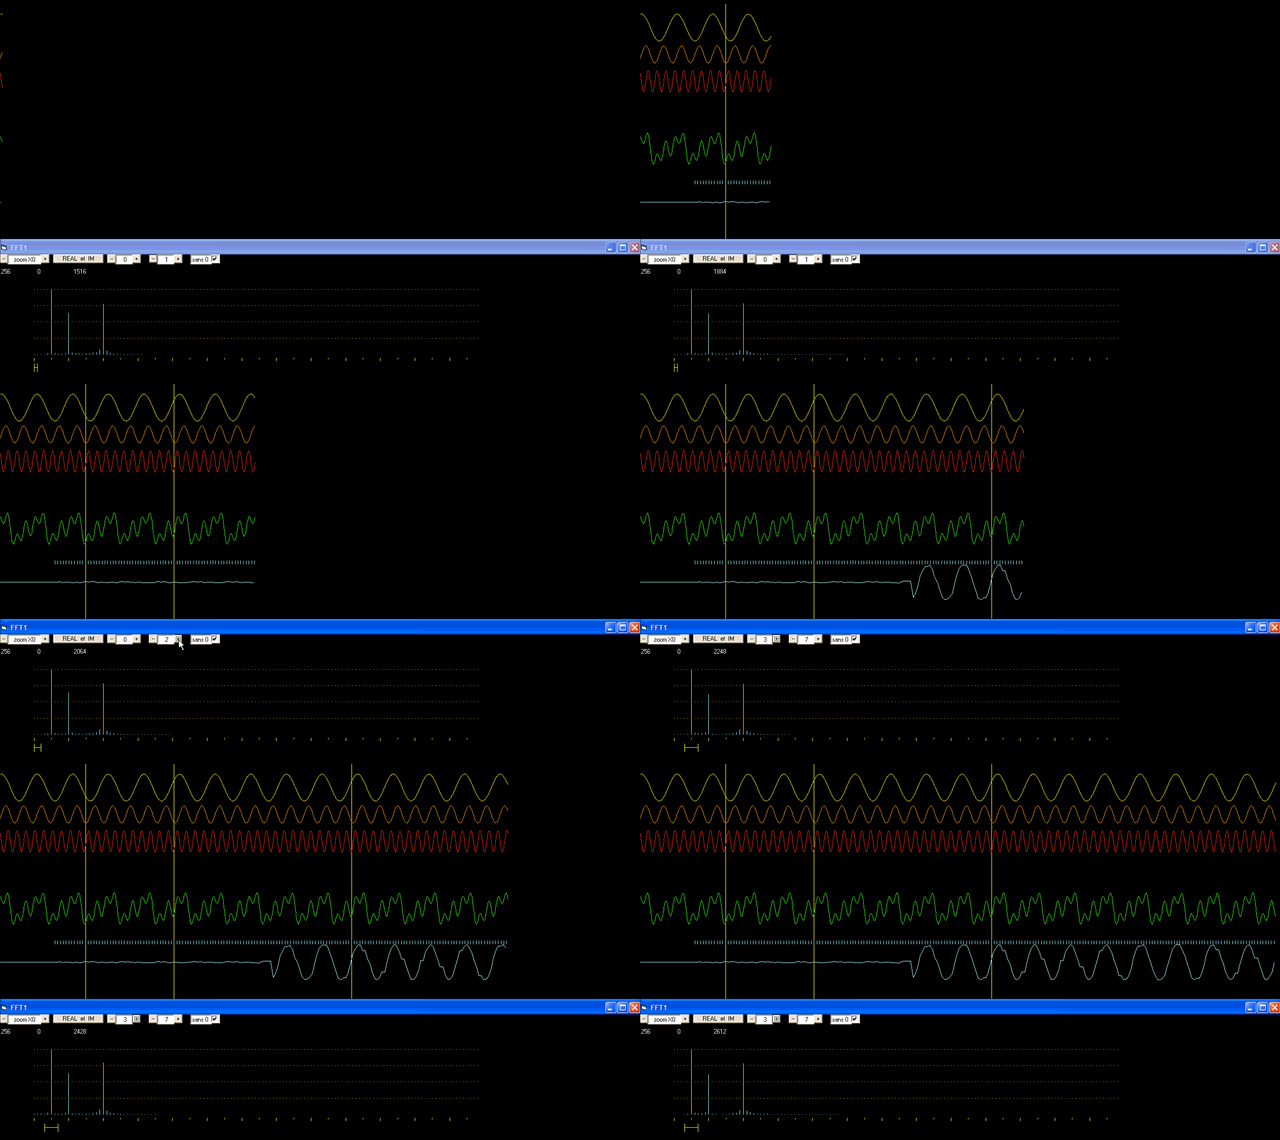
The FFT ou Fast Fourier Transform is a mathematical algorithm allowing to extract the different frequencies componants from a wave.
The green curve has 3 differents componants:
By applying a Fourier transform to the green curve, we obtain three peaks corresponding respectively to frequencies 5, 10 and 20 (in the graph below). Starting again from these peaks, another mathematical process (the inverse Fourier transform) allows us to recreate the wave corresponding to the desired peak : the blue curve recreates the curve corresponding to the first peak of 5 cycles /time unit. The blue curve, although extracted from the green curve recreates only its first component (the yellow one).
|
|||
| Tous droits réservés - © P. BOTTE 2010 - compteur statistique : |
